Friday, December 25, 2015

Approximating the Yardage of an Interception in the Aggregate

So, it is established that an interception is valued at about 60 yards, an increase from the 45 yards it was previously ascribed. The model used to establish that value of 60 yards is one of several based on expected points (EP), this one developed by Brian Burke. EP models provide the average amount of points expected to follow a play on a given down, with a given distance to go, and from a given spot of the ball, based upon the average next-score for all previous plays with a given down, distance, and field position. The next-score may occur on the forthcoming play, the following play, or on a play three possessions later. The next-points could be scored by the offense (TD, FG), the defense (INT or fumble return for TD, safety), or maybe the defense's offense (following TO, turnover on downs, punt or otherwise). Positive EP values indicate offensive success and negative values, failure. 

Estimated points can then be converted to yardage values. For instance, 1st and 10 at the 50-yard line carries +2.0 EP. That indicates that, across many, many 1st and 10 situations at the 50, in many games, and in many seasons, the average next-points equals +2.0 EP. Likewise, 2nd and 8 from the opponent's 48-yard line will carry its own EP.

Anyhow, the value of 60 yards is derived from the expected point difference between interception plays and non-interception passing plays, across teams in many seasons. That is, the average EP for all non-interception passing plays from all down, distance, and field position situations compared to that average for all passing plays resulting in an interception. The EP difference between non-interception and interception pass plays is +3.8. For the offense, the EP value of +3.8 is equitable, roughly, to having the ball at the opponents’ 20 yard line. EP for the offense equal zero when the ball is at an offense’s own 20 yard line. The difference of the two field positions is 60 yards, hence the 60-yard valuation of interceptions.

I used Burke’s work to guide my development of team-specific, aggregate yardage values for interceptions. Of course, I sought a yardage value individualized for each team and, accordingly, EP for given down, distance, and field position situations are known to vary by team for teams' offenses and defenses. However
—foreshadowingcomputation of within-season team EP values is confounded by a small sample size. Anyways, like EP, an interception yardage value should also vary by team—but how? Well, these were my criteria: INT-yardage should
 

Figure 1.
  • increase for teams with productive offenses (as measured by yards per drive and plays per drive)
  • increase for teams with efficient scoring offenses (as measured by % of drives end in a score), 
  • decrease for teams that struggle to limit the productivity and scoring efficiency of opposing offenses (as measured by allowed yards per drive and % of drives ending in a score), and
  • decrease for teams turnover prone offenses (as measured by % of a defensive team's offensive drives ending in a turnover).

To start, I sketched a football field and partitioned the field according to defensive drive start and opponents yard per drive. We can sum these two values, which I did for all NFL teams from 2010 through 2014. However, we then subtract that value from 100 ensuring a greater value for defenses that allowed fewer yards. This process, I was certain of and we’ll term it the Defensive Component.

I was less certain of how to include team offensive starting position and offensive yards per drive. Rather surreptitiously, I summed those two values with the Defensive Component above and noticed that the mean across team seasons equaled 100.044. I got excited and termed it the Offensive Component.


I simply subtracted 40 from the sum of the Defense and Offensive components. Voila, the average was 60.044.  Normality for the entire data set appears in Figure 1 with the distribution plotted in orange against a normal curve. In Figure 2 we see that the average of 60 yards is stable across all seasons in the data set, as are the centralities of the standard deviations. 
Figure 2.

The greatest yardage value was 73, for the 2012 Denver Broncos and 2011 New Orleans Saints and the least was 45, for 2014 Oakland Raiders and 2011 Indiana Colts. By several metrics (this one and this one),  Denver ranked among the top offenses and defenses, the New Orleans offense ranked top 1 or 2, Oakland amongst the lowest in offense and toward the bottom in defense, and Indiana relegated itself to the lower bounds offensively and defensively, in their respective seasons. 

Analyzed next were the relationships between interception yardage values and various team-offensive and -defensive attributes bulleted above. As seen in Figure 3 at the bottom of the page, most potent were the rate of offensive scoring drives increasing and rate of scoring drives allowed decreasing with increased yardage values.1 Likewise, the rate of offensive turnovers decreased as interceptions yardage values increased. These associations are ecologically valid because only some interceptions are a pick-six—12.5%—and the defense depends on its offense to capitalize. Absent from Figure 3 is a small r = -.19 (p = .01) for the relationship between Defensive plays per drive and interception yardage.

Also, Pro Football Reference provides EP values for plays so we could use these to compute EP values for, say, the 2012 Denver Broncos.2 Following Burke's methods, we compute the average EP for all non-intercepted, non-4th down passes thrown against the ’12 Broncos defense. Separately, we compute the EP for passes intercepted by the Broncos. Because it is such a small sample size, I also computed League-wide average EP on interceptions for 2012. Non-intercepted, non-4th down passes equaled +2.11 EP and intercepted passes equaled -2.73 and -3.02 EP for league and team averages yielding differences of +4.83 and +5.14 EP, respectively.


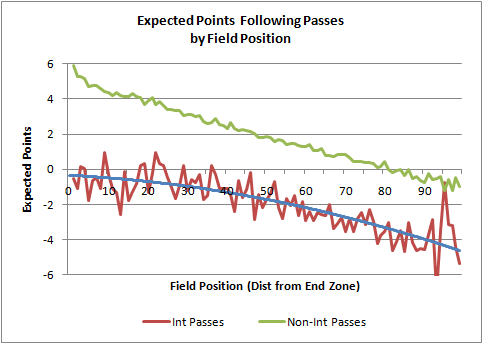
We could plot non-intercepted pass EP values by field position, as I did initially. Using only the ’12 Broncos’ data, EP is first less than zero at the Opponents’ 35 and EP is first greater than 4.31 at the Broncos’ 29 or so. That would make the INT yardage value 36. Meh....the perils of inadequate power. (For example, see this supplementary figure [green = non-INT] and compare it to Burke's graph in this write-up. The INT EP is League-wide 2012 averages. On my figure, that sharp dip in INT EP around the 95 is the result of insufficient.)

Figure 3.

So, as an alternative approach, I computed the average yard-line field positions for EP ≤0,
4.83, and 5.13 for non-interception pass plays. For non-interception pass plays against the Broncos D, the average EP ≤0 was about the 23-yard line. Using the difference of the League average INT EP, the average field position was 91-yard line (DEN 9). Using the difference of the Broncos team INT EP average, the average field position was the 94 (DEN 6). That puts the differences at between 69 (league) and 71 (DEN) yards. Recall, the value estimated above for the Broncos was 74; so we're fairly accurate, between +2 to +3 yards using the aggregate method I outlined above. But that's only one team.

It's a fairly simple processobtaining the PFR EPbut I lack the motivation to check for all teams in seasons 2010-2014. I did check the 2011 Indianapolis Colts. Non-intercepted, non-4th down passes against the Indy' D yielded an average +2.19 EP; League INT, -2.5 EP; and Indy team INT, -2.8 EP. Those EP values equate in field position to ~26 (≤0), 82 (League), and 82 (IND). Thus, the difference equals ~56 yards, or, a difference of about 9 yards from the formula I described above.

Given that disparity, I also checked the 2014 Oakland Raiders. Non-intercepted, non-4th down passes against the Raiders defense yielded an average +2.11 EP; League INT, -2.73 EP; and team INT, -3.03 EP. Those EP values equate in field position to ~28 (≤0), ~78 (League and OAK INT). Those both yield yardage differences of about 50. This is only +5 yards than the 45 I mentioned earlier.

In summation I introduced here a method of computing team-specific yardage values of interceptions. It is well-established that that value is about 60 yards but that value is more so a League average, per se. So, I cross-checked the interceptions yardage values for several teams using estimates based on the EP differences (similar to the method used to obtain the 60 yard value). There were discrepancies between the results of my aggregate method and the EP estimates, two of which were |5| and one was +9. These discrepancies may be due to mathematical failures on my behalf or the crude computation of average field position differences for EP values. It could also be that Burke and PFR obtained EP values with different models. Of course, it could be some other issue that I have overlooked.


Footnotes:

1The decimal values in Figure 3 are Pearson Correlations NOT Linear Regression Coefficients. This is because we are simply interested in relationships between variables (i.e., correlations) not explaining variance of the INT yardage values. However, the fuzzy line for each correlation is based on the linear regression equation. I included the line for convenience in visualizing the relationships.
2Some plays in the PFR lack EP data so those were removed from analysis unless it was a pick-6, in which case I made the EPA -7.


Tuesday, December 22, 2015

Passes Defensed on Standard Downs Compared to Passing Downs: Are Some Defenses More Aggressive than Others?

Football is largely a game of competing strategies. Aside from coaches’ philosophies, players’ executions, and those of opponents, strategizing is dictated by fluctuating situational factors within each game. One factor is garbage time which occurs when a team is winning or losing by a large margin. Here, winning offenses might play more cautiously to maintain their lead whereas losing defenses might take risks to reduce the scoring margin. Likewise, losing offenses might pass the ball more frequently attempting to score rapidly whereas winning defenses might play to prevent large passing gains. We will revisit garbage time shortly.

A second factor or set of factors influential in determining strategy are standard and passing downs. Standard downs are defined as 1st downs, 2nd & ≤ 7, and 3rd or 4th & ≤ 4. Passing downs are defined inversely; 2nd & ≥ 8 and 3rd or 4th & ≥ 5. Extreme philosophies notwithstanding, on standard downs, offenses could pass or run with equal likelihood given the yards needed to secure a first down. Alternatively, on passing downs, offenses should be more likely to pass the ball given the yards needed to secure a first down. In college football the distinction is generally reflected statistically: Prior research indicates that offenses will pass on ~40% of standard downs and on ~67% of passing downs.

I am curious if passes defensed (hereafter: PD)—pass break-ups and interceptions—occur more frequently on passing or standard downs. Defenses should be attuned to what is coming on passing downs (i.e., a pass), should adjust their personnel (e.g., more men in coverage), and passes should be defensed more readily. Alternatively though, the opposite may be true if a defense is atypically aggressive. Summarily, I expect that PD occur more frequently on passing downs. Of course, we will use proportions (e.g., passing down PD/passing down PA) to mitigate the greater quantity of passing known to occur on passing downs. 


So, to start, I randomly selected 27 D1 games from 2014.1 Play-by-play data of some games required considerable manipulations to fit in the MS Excel parsing system I devised; those were excluded. The sample was too small in my opinion—14 games—but then I remembered the publicly available data from the Football Study Hall 2013 Charting Project; much thanks is due.  It contains play-by-play data from 202 games. I combined that with my comparatively minute data set and computed PD proportions for passing and standard downs for each team in each game.

Non-normal distributions of the standing and passing down PD proportions obligate the use of a Mann-Whitney test. This test compares group median instead of average and lacks assumptions of normal distribution which, if violated, could undermine the results when using techniques that compare averages. That is, the proportional PD data are non-normal.

PD were found to occur more frequently on passing downs than on standard downs (Uobserved = 77734 < Ucritical = 84127, z = 3.74, p < .001, two-tailed). The median proportion of PD for passing downs, .125 (IQR = .161), was greater than that of standard downs, .097 (IQR = .11), a difference of .028 (95% CI ± ~.014). An effect size of .12 indicates a small to medium difference.

The results corresponded to my expectations but we do need to account for garbage time because defenses adjust their protections. Winning offenses may abstain from passing to prevent PD and INTs that stop the clock and forfeit possession, respectively. Winning defenses may become more amenable to completions underneath coverage while preventing large gains (i.e., less likely to attempt PBU or INT). To adjust for garbage time, I computed PD proportions for passing and standard downs occurring outside of garbage time. The results are similar but the difference is less pronounced. The median proportion of PD on passing downs, .118, was greater than that of standard downs, .10, a difference of .018 (z = 3.02, p =.003). An effect size equal to .07 indicates a small but significant difference.

The results support the hypothesis that a greater proportion of passes thrown on passing downs are broken-up or intercepted than on standard downs. But what else can we glean from this data? We can gain insight into team defensive tendencies, that is, how aggressive a team is at defensing passes.

Although voluminous and grand, the FSH data set contains only 202 of the 868 games played in 2014. Thankfully, however, the project was crowd sourced to who?—to fans. It appears several devotees charted all or nearly all (-1 or -2) games of their beloved warriors. Those teams appear in the table below.


Table 1. Sampling NCAA Team Defenses PD% on Passing and Standard Downs, non-Garbage Time
Passing Downs Standard Downs PD%
Team Games PA PD PA PD Passing Downs Standard Downs sdPD% / pdPD%
Virginia Tech 12 184 35 154 28 0.190 0.182 0.956
Illinois 10 104 6 164 9 0.058 0.055 0.951
Northwestern 12 153 26 254 36 0.170 0.142 0.834
Oklahoma 13 176 31 211 30 0.176 0.142 0.807
Cincinnati 10 116 20 138 18 0.172 0.130 0.757
Kansas State 11 132 21 184 19 0.159 0.103 0.649
Washington State 11 135 21 232 18 0.156 0.078 0.499

In the rightmost column we find the ratio of PD on standard downs to PD on standard downs. As that value increases, ostensibly, it indicates how aggressively a defense makes plays on balls in the air. That is, teams that defense more passes on standard than on passing downs may be more aggressive. However, this is not granted; it may be that a team's defense faced pass-drunk teams or faced trailing teams passing to score quicker outside of garbage time. Also unaccounted for is the effectiveness of that aggressiveness, Illinois.

An existing metric, PD-to-INC, or PD to incompletions, is used to gauge defenses' aggressiveness defensing the pass. So, I compared sdPD%/pdPD% to PD/INC and that can be viewed in the table below. The stats used in computing the values shown in the table were culled from College Football Stats. We find some nuance there because, with PD/INC Kansas State appears to be the second-most aggressive defense within this small sample. However, in sdPD%/pdPD% K-State falls to fifth in our set.


Table 2. Comparison of sdPD% / pdPD% to PD-to-INC
Team PD Att. Inc. PD / Inc. pPD%/sPD%
Northwestern 70 445 179 0.391 0.834
Kansas State 68 458 181 0.376 0.649
Virginia Tech 70 363 188 0.372 0.956
Oklahoma 62 409 184 0.337 0.807
Cincinnati 57 438 184 0.310 0.757
Washington State 48 458 172 0.279 0.499
Illinois 31 354 123 0.252 0.951

So, in conclusion, passes are defensed more frequently on passing downs than on standard downs. Also, I have suggested that the greater the ratio of PD on standard downs to PD on passing downs, the more aggressive a defense. Virginia tech ranks atop my small sample and there is some support for this notion that the Hokies' secondary and coverage backers were a ball-hawking bunch. However, a shortcoming of the ratio: it provides no indication of effective pass defensing. As it is with science though, we must draw conclusions other than a "shortcoming." Considering the complexities inhere in football, it may be that an aggressive secondary may be rendered less effective by an inadequate pass rush or that its aggressiveness exceeds the execution of its coverage personnel, both of which appear to be the case for the 2013 Illini.


1 I assigned each 2014 FBS football game a random number between 0 and 999,999. Next, a list of random numbers between 0 and 999,999 were generated until 27 of those corresponded to a 2014 FBS football game. Beforehand, I anticipated using a Washington State game (highest rate of passing in ’14), a Louisiana Tech game (tied for 1st in total interceptions, 7th in pass break ups), and a Louisville game (Gerod Holliman tied NCAA D1 record of 14 INTs). Then I remembered the FSH data set so the U of L game was excluded.

Sunday, December 13, 2015

Should Offensive Line Holding and Intentional Grounding Penalities be Included in Havoc Rates?

Havoc. ©Getty Images, 2015.
If you’re a fan, you’ve lived it: Havoc. We bargain with disinterested gods for retribution in the form of pass interference because their corners have batted away our every pass and must be defrauding the game; we shriek obscene declarations and demand goblets of enemy blood when our defense stuffs their speed back at the edge…again; we resign to stormless disharmony with a slightly lowered heart rate as our redshirt freshman tackle falls on our quarterback’s fumble. It’s havoc. And as an aspiring defensive back, I love havoc too.

Pioneer Bill Connelly of Football Study Hall defines Havoc as the percentage of plays in which a defense makes a tackle for loss, forces a fumble, or defenses a pass (by interception or break up). Connelly notes that hurries on the QB or QB hits would be included in Havoc if the stat was more consistently recorded. As I often do, I began wondering if there were other, more reliably registered statistics that could be included to account for pressuring of the QB.

Kentucky-Tennessees game are required viewing for all KY residents. During the 2015 football iteration, the idea of considering in Havoc holding against offensive lineman happened. On their last drive of the 3rd quarter, UK O-linemen were penalized for a block in the back and a hold and also surrendered a sack.  UK’s first drive of the 4th quarter produced two more holding calls and the next drive ended when UT recovered a forced fumble; the previous two drives concluded with a punt and a turnover on downs, respectively. UK scored zero points on those three drives that spanned 16 plays (i.e., excluding penalty-plays and punts).

If you happened to see these sequences you would know the UT front-7 were Kieth-Moon-in-a-hotel-room in the UK backfield. Thusly, the UT defense would receive a Havoc rating of 18.8% for those three possessions (3/16)—slightly better than the 2015 national average of 16.1%.  However, if we also include those 4 penalties in that equation, UT’s defense nearly doubles Alabama’s nation-leading 23.1% with a suffocating 43.8% Havoc.

Speaking of the Crimson, I watched their D generally smother LSU’s hopes of moving the chains forward. In the fourth quarter, LSU QB Brandon Harris completed a pass for 2 yards to ineligible left tackle Jerald Hawkins—an illegal touching penalty Saban declined.    Upon seeing that, I thought that intentional grounding may also provide an alternative measure of QB pressure, as well.

I had zero desire to gather enough college game play-by-play summaries to warrant a reasonable sample. So I started with NFL play-by-play data from 2014 and 2015. I inspected correlations between game-by-game sacks allowed and offensive holding penalties (not per game, i.e., n = ~1400). Found no appreciable relationship there nor between sacks and false starts. I supposed I could have computed game proportions but was feeling uninspired so I shifted my focus to the season in aggregate.

That the NFL provides cumulative QB hit data is a benefit of using seasonal data.  Likewise, I serendipitously discovered NFL Penalties dot com which allowed me to extract team-offensive lineman holding penalty data.  I also extracted intentional grounding penalties. Plus, the site offers declined and offsetting penalties, which I included in the analyses. Next, I computed several proportions for all NFL teams 2009 through 2014:
 

  • O-lineman holding calls / total offensive plays; 
  • intentional grounding calls / (pass attempts + sacks); 
  • QB hits allowed / pass attempts. I excluded sacks from the denominator because a TD pass and QB hit can occur on the same play whereas a sack ends a play. Similar distinctions have been made in the literature;  and
  • team totals for QB rushing attempts, which exclude sacks.   I expected that this might somehow interact with the aforementioned variables.
Inspected first were correlations of pertinent variables. Those appear in the figure below and given the association between QB hits and QB rushes, we know that accounting for QB rushes will be necessary. Do note that I excluded Intentional Grounding proportions equal to zero in the figure but included zero values in the analysis. Also excluded from the figure is the relationship between O-linemen holding and QB rushing, which also needed to be accounted for, r = .19. 


Next, we regress QB hits onto QB rushes and obtain the residual values (i.e., the values if the two variables are unrelated), R2adjusted = .062, F(1,190) = 13.57, p < .001. We then regress O-Lineman holds onto QB rushes and obtain those residual values, R2adjusted = .03, F(1,190) = 6.96, p = .001. Intentional grounding was unrelated to QB rushes.

Lastly, we regress the O-Linemen holding residuals onto QB hit residuals. This regression revealed that, when controlling for QB rushing, QB Hits accounted for 4% of the variance in O-Linemen Holding penalties,
R2adjusted = .04, F(1,191) = 8.6, p = .004. Similarly, when controlling for frequency of QB rushing, QB hits accounted for 2% of the variance in Intentional Grounding penalties, R2adjusted = .02, F(1,190) = 4.76, p = .03. More ecologically, when intentional grounding and O-linemen holding penalties increase, it is expected that QB hits are probably increasing.

The explained variances are paltry, indeed, however significant. This finding would potentially be alleviated, or at least a more sound explanation elucidated, if the variables were examined on a game-by-game basis. I checked and OL experience was inversely related to the penalties and to QB rush frequency. I could have controlled for experience but declined to do so since correlations were weaker than each of the others reported above.


It is also worth noting there is a meager relationship of holding with sacks that is negated when controlling for QB rush rates. Likewise, either controlling for or ignoring the influence of QB rush frequency, OL holding calls are essentially unrelated to negative rushing rates (i.e., negative rushes / rushes). This latter point underscores another shortfall of the current examination: In future analyses, it would be beneficial to separate OL holding penalties for pass and rush plays. Lastly, the data examined here is from NFL data. It may be the relationship of these penalties and QB hits is more pronounced or altogether absent in the college game.

In conclusion, I advocate here for, if not the inclusion of, then the further analysis of the effect of including opponents' holding penalties by offensive lineman and intentional grounding penalties in the calculation of college football Havoc rates. I would lean to the latter because intentional grounding penalties are infrequent and generally resultant of a QB overwhelmed by the pass rush. I also wonder if blocked kicks and punts should be included in Havoc rate. Although a distinction must be made between special teams and defensive, blocks do occur on defensive special teams plays. Also, D-Linemen and LBs tend to lead the nation in blocked kicks and punts.