Showing posts with label interception yardage. Show all posts

Sunday, July 17, 2016

Field Position Part II


In a previous post I discussed how INTs and INT return yardage influenced starting field position (SFP). I will extend that discussion to include each of the other events that directly result in SFP: turnover-fumble returns, kick and punt returns, and missed field goals by opponents. As an aspiring defensive back, I of course took great care discussing interceptions. I will devote little discussion here to fumble recoveries and missed field goals. I will harp on kick-off returns but refrain from discussing punt returns at any depth.

Let me first state that my play-by-play (PBP) data differs slightly from the official record. I excluded yardage gained on returns for TDs in the analysis because a TD precludes SFP. Excluded also was return yardage gained prior to a turnover-fumble.

Concerning INTs, I emphasized that ending opponents’ possessions is most salient and that INT return yardage is a somewhat superfluous stat. INT return yards may be useful to compare playmaking abilities between DBs, although statisticians, teams, and observers might be better served knowing the SFP that resulted from an interception. This notion is definitely applicable for fumble returns where, again, the ending of opponents’ possession is most salient.

Likewise, it is also relevant for rating punt returners. For instance, a player fair catching a punt at his own 9-yard line would be recorded as a fairly unremarkable zero yards (i.e., it is counted in his average PRY). However, the fair catch was probably initiated in the presence of proximal defenders who could have disrupted the impetus of the punted ball at say, the 2-yard line had the returner declined to fair catch. Thus, by fair catching—despite accruing zero yards—the returner in the example would improve his team’s SFP by 7 yards (of course, the defense downing the ball is hypothetical).

The foregoing notion of field position in lieu of yardage is applicable to kick returns as well. For example, let us review the 2014 NFLleading kick-returners by average yards per return. I have Bruce Ellington of the 49ers at 24 returns for 25.9 yards per return;c.f. he ranks about ninth in KR yards. However, Ellington gives his offensive teammates an average starting FP at the ~23-yard line—18th on my list of qualifying players. It may be poor decision making on his behalf or poor block execution behalf of his teammates or that he generally fields kickoffs from superior kickers but we must acknowledge Ellington’s average catch-spot (CS) on KRs was nearly 3-yards into the endzone, ranking third-deepest on my list of qualifying players.1

Although this post is about SFP, the above anecdotes underscore the entanglement of variables involved in appraising performances with yardage accrued. However, Ellington still gained those yards. If we are comparing players (or even coverage units), perhaps, Ellington does rank ninth in KR yards. However, football is about team success and on a given drive, a team is increasingly inclined to success the closer it begins to its opponent’s endzone. Conversely, Ellington’s team did start 3 yards closer to the endzone then would result from him taking more touchbacks.

Moving on, for all teams in the 2014-15 NFL season, I obtained all non-TD turnover-fumble returns, interceptions, kick and punt returns, and field goals missed by opponents using the Pro-Football Reference PBP searchtool. Opponents’ missed FGs include blocks but excludes blocks returned for TDs. For all plays except opponents’ missed field goals, I extracted [a] the spot of the INT, fumble recovery, or catch and [b] the spot at which the player was downed following the return. Computed with those values were [c] return yards or 20 for a touchback and [d] the SFP of the player’s offensive teammates. SFP was scaled such that teams’ own goal lines equaled zero and opponents’ goal lines equaled 100; greater yards indicate better SFP.


Table 1. Counts, Average SFP, and Average Return Yards for Events Resulting in SFP, NFL 2014-15
TEAM TOTAL EVENT COUNTS AVERAGE STARTING FIELD POSITION BY EVENT AVERAGE RETURN YARDS BY EVENT
KR PR FR INT oMFG SFP KR PR FR INT oMFG KR PR FR INT
KAN 68 76 5 5 5 29.3 25.4 28.7 22.4 44.0 23.6 25.4 8.6 0.0 15.2
CIN 78 74 5 19 5 30.3 24.7 30.3 27.4 50.8 26.0 24.9 8.4 0.0 9.2
NWE 68 64 7 16 5 30.6 22.7 32.0 36.9 51.8 29.6 22.1 7.5 0.4 11.7
DAL 75 66 12 16 2 28.9 21.1 26.9 35.5 43.3 21.0 22.3 7.3 2.6 9.3
TAM 81 63 11 11 7 26.6 20.7 25.3 30.1 48.8 32.6 21.6 7.2 1.3 6.9
IND 79 88 13 11 4 28.7 22.5 28.4 30.3 43.2 24.0 24.3 7.0 2.6 8.7
BAL 68 73 12 10 6 28.7 23.3 30.4 32.9 48.2 27.8 22.9 6.9 4.3 9.1
JAX 92 74 12 5 4 25.7 22.1 21.5 24.3 51.0 31.8 21.9 6.4 0.8 13.0
PHI 83 85 16 9 5 30.0 22.9 28.8 33.8 41.6 23.4 20.9 6.2 6.3 6.2
MIN 73 74 4 11 6 27.3 25.0 25.5 15.3 49.0 30.3 21.9 6.2 0.0 8.2
STL 79 74 11 10 1 28.0 22.1 28.8 32.4 42.1 35.0 22.9 5.9 3.3 10.8
BUF 71 86 8 18 7 30.2 21.3 27.0 25.5 60.4 26.9 20.6 5.9 4.4 19.2
OAK 94 81 4 9 5 24.2 19.9 24.7 26.0 61.9 24.2 21.4 5.7 5.3 8.4
CHI 97 49 8 13 6 25.9 21.1 27.0 15.9 43.6 23.8 20.5 5.6 2.4 10.9
SDG 81 66 8 6 2 26.4 21.3 26.5 24.1 31.7 33.5 21.1 5.5 0.0 12.0
SFO 70 74 5 21 0 27.8 22.6 28.3 16.2 48.0 - 22.9 5.5 0.0 18.8
ATL 89 55 7 15 4 26.5 22.4 25.7 32.3 40.5 27.5 22.5 5.4 5.6 6.9
MIA 82 57 10 11 6 31.1 24.2 25.5 21.3 50.6 23.5 23.9 5.3 0.0 17.1
DEN 75 84 5 16 5 28.9 22.6 28.2 26.0 54.4 25.2 21.4 5.3 0.4 10.8
TEN 89 72 6 11 5 25.8 23.2 24.8 38.8 52.7 31.0 22.5 5.2 7.2 10.8
ARI 76 77 5 15 4 26.9 19.6 24.8 20.8 51.3 32.5 20.2 5.1 1.8 10.3
NYJ 85 79 7 6 5 27.8 22.5 26.6 31.4 35.0 24.0 22.1 5.1 0.3 9.0
PIT 86 66 10 7 2 25.7 20.7 24.9 32.5 48.9 29.5 21.1 5.0 3.9 18.1
NYG 87 74 9 16 2 28.2 20.7 23.7 31.6 62.1 24.0 21.1 4.9 1.5 16.6
GNB 79 60 7 15 1 28.5 20.1 27.0 37.4 54.7 29.0 20.3 4.8 0.0 15.2
CAR 83 69 13 10 4 27.7 21.8 25.5 32.5 45.2 25.8 21.0 4.5 2.8 19.0
SEA 62 81 9 11 2 30.5 22.4 27.7 29.0 58.2 32.5 21.4 4.2 0.0 14.2
CLE 72 83 7 18 3 26.8 22.6 24.9 27.7 54.1 34.0 22.8 4.2 4.9 14.4
WAS 85 80 9 6 3 25.1 21.4 22.7 29.0 45.5 18.0 20.8 4.0 2.1 5.0
HOU 71 82 10 16 2 27.7 20.4 23.5 31.9 60.6 26.5 20.7 3.8 8.7 16.6
DET 70 81 7 18 4 29.9 21.1 29.4 32.9 59.2 27.3 21.8 3.8 1.8 18.7
NOR 86 62 6 12 0 25.5 22.2 22.0 18.5 42.9 - 22.3 3.0 0.0 12.5
League Event Counts Average Field Position by Event Average Return Yards by Event
AVG 79 73 8 12 4 AVG 27.9 22.0 26.5 29.1 50.5 27.2 AVG 22.0 5.6 2.3 12.3
SD 9 10 3 4 2 SD 1.8 1.4 2.5 6.4 7.6 4.2 SD 1.3 1.3 2.4 4.2

Table 1 contains 2014-15 distributions, NFL team average SFP and yards gained for each event, and League averages thereof. KRY and PRY are computed with touchbacks equal to 20 yards and no return equal to zero yards. Neither New Orleans’ nor San Francisco’s opponents missed FGs, apparently. There is nothing particularly noteworthy in the table, otherwise.

I also can tell you several things. INTs have the largest impact on the next-SFP when statistically controlling for the initial play spot, the spot at which an INT, fumble recovery, or kick/punt catch occurred, and the yardage gained on the return.2 I can also tell you that for all NFL teams, the majority of SFP yardage is derived from either KR yards or PR yards. Table 2 provides some insight into why this is.


Table 2. Characteristics of NFL Based on Majority of SFP
Majority of Team SFP From
VARIABLE KR PR
Teams Count 11 21
avg SFP 27 28
avg SFP Unproductive Drives 24 24
avg KR-SFP 22 22
avg Unproductive Drive Yards 17 16
avg Punt Yards 45 45
Opp avg Punt Return Yards 9 9
avg Def. SFP After Unproductive Drive 24 23
Opp avg Unproductive Drive Yards 16 16
Opp avg Punt Yards 45 45
avg Punt Return Yards 5 6
% All Drives Turnovers 14% 11%
Opp % All Drives Turnovers 12% 12%
% All Drives End w/ Score 32% 35%
Opp % All Drives End w/ Score 39% 32%
win% 35% 58%
NOTE: Unproductive drives are defined as those that end without a score.
Scoring drives are those that ended in TDs or FGs.


In Table 2 we see that the two types of teams perform similarly in most situations. Notably, teams whose majority of SFP is derived from KRs commit TOs slightly more frequently. As an aside, this might suggest that while essentially random, a modicum of TOs may be attributable to offensive ineptitude (albeit, in single season sample). Those teams’ opponents also end drives by scoring considerably more frequently—23% more—than teams whose majority of SFP is derived from PRs. The PR-teams score slightly more frequently.

Most striking in Table 2, though, is the disparity in win percentage. The KR-teams can be expected to win 5.6 games whereas PR-teams can be expected to win 9.3 games. Thus, I conclude that, despite the indelible impact of Devon Hester or the ’84 Seahawks’ 3-4 monster, ultimately, SFP is largely the result of an ungenerous defense supplemented by relatively consistent and careful offensive play.

Summarily, the impact of various events on starting field position was examined using data from the 2014-15 NFL season. Although INT yards are most impactful on SFP in isolation, when statistically controlling for event-spot and return yardage, the majority of SFP is derived from either KR or PR yards. Likewise, winning teams garner most of their from PR yards. I concluded that this effect is likely due to defensive stops and consistent, careful offensive play.


1 Minimum 1 KR per game scheduled.
2 To accomplish this, SFP was regressed on to play start spot, event spot, and yards gained. The residuals were saved. An ANOVA was performed with those residuals as the dependent variable and event type as the independent variable. A significant effect of event type was found, F(4, 5641) = 17.422, p < .001. Roughly, planned post hoc comparisons indicate the effect of event on SFP could be ranked as INT > FUM > PR > MFG > KR.

Saturday, January 16, 2016

Field Position Part 1: Interception Return Yards


In a previous post I mentioned my intent to explore the effects of defense and special teams on field position. This is part one of that investigation. In another post I offered a method of valuating the average yardage of an interception (for the intercepting team). At present, I will discuss a different method of calculating and valuating INT yards using play-by-play (PBP) data.

Yes, collegiate and professional statistical records include yardage gained on interception returns just as passing or rushing yards are included. However, we track passing and rushing yards as a measure of progress and productivity—a measure of player or team performance. We track interceptions because each signifies an exchange of possession. The interception itself is the measure of player or team capacity—not the yardage gained on returns. Interception return yards are unexpected gratuity.
Chris Harris picks off and returns a Kyle Orton pass.

For instance, consider two interceptions from 2014. A Tony Romo pass was intercepted by NY Giants’ Prince Amukamara and Buffalo Bill Kyle Orton’s pass was intercepted by Dever Bronco Chris Harris. Amukamara and Harris were each credited with 38 INT return yards. Amukamara’s half way through the second quarter of a tie game and Harris’ with 5 minutes remaining in the third quarter, his team leading 21-3. Both players’ offenses scored on their following drives. So what differentiates Amukamara’s INT return from that of Harris? Field position.

Amukamara intercepted Romo’s pass at the NYG 35-yard line and returned the ball to the Dallas 27. Harris intercepted Orton’s pass at the Bronco 2-yard line and returned it to the Bronco 40. Indeed, Harris’ INT may be more valuable because he ended the possession of an opponent in scoring position.[1] But, Amukamara’s 38 INT return yards put his offensive teammates in field goal position before they lined up.

An offense gaining no more than 2.3 yards on every play of every game would be disbanded. A DB intercepting one pass per game and being downed at the spot of each INT would receive a max contract and an eponymous island. No writers would denigrate him for failing to gain yardage after the INT. Any coach or fan would prefer an INT returned to the 50 than one returned to his own 3, of course; but surely every coach or fan would prefer an INT to the opponent having possession. 

To me this means that, although there is value in knowing the yardage gained from the spot of an interception to the spot an interceptor is downed, ultimately, it is more meaningful knowing the field position produced by that gained yardage. That is, both players in our example should be credited 38 INT return yards but the values in the game at the point of each player being downed were more accurately described as 73 or 40. This is particularly true if we desire statistics that reflect happenings on the field.

I ran a Pro-Football Reference Game Play search for all interceptions in 2014 regular season excluding pick-sixes and interceptions with lost fumbles on the return. Pick-sixes were excluded because a touchdown precludes an offense driving and, thus, are uninvolved in the tabulation of average starting field position. Four returns with fumbles lost by the interceptor and recovered by the intercepted team were excluded because possession was regained.

Extracted from that data were the (a) spot of the interception and (b) spot of being downed following INT return. Computed with those values were the (c) interception yards from the spot of the INT to the spot of being downed or 20 for touchbacks and (d) starting field position for the interceptor’s offensive unit measured from a team’s goal line to b, the spot of being down. All spot-yardage values were scaled from 1 to 99 with 1 being the intercepting team’s own goal line and 99 being their opponents’ goal lines.

Table 1 contains various interception statistics for 2014 NFL teams, including League averages. The interception return yardage value we are interested in is Mean INT FP column. Teams are ranked by average starting field position following interceptions. Interestingly, I was forced to revisit my earlier debate of the greater value of Amukamara’s and Harris’ interceptions. It appears that over the course of the 2014-‘15 seasons, the Giants’ defense endowed their offense with the greatest field position advantage with interceptions but the average spot of their 16 interceptions was nearly midfield. Compare this to the average spot of the 16 Dallas Cowboys interceptions, their own 30—where opponents are within field goal range. Although intuitive, interception spot increased with field position following interception (N = 393, r = .81, p < .001). Interception return yards also increased with field position following interception (r = .41, p <.001).


Table 1. Interception Yards and Interception Field Position (Yards) Following Interceptions for 2014-15 NFL Teams
TEAM Mean FP Non-TD INT Mean INT Spot Non-TD INT Yards Mean nTD INT Yards INT FP Yards Mean INT FP
SDG 26.4 6 18.8 72 12.0 185 30.8
CAR 27.7 10 23.4 190 19.0 424 42.4
NYJ 27.8 6 24.7 54 9.0 202 33.7
KAN 29.3 5 27.0 76 15.2 211 42.2
CHI 25.9 13 30.1 142 10.9 533 41.0
PIT 25.7 7 30.1 127 18.1 338 48.3
DAL 28.9 16 30.3 149 9.3 634 39.6
NWE 25.5 12 30.9 140 11.7 511 42.6
STL 28.0 10 31.3 108 10.8 421 42.1
ATL 26.5 15 32.1 104 6.9 586 39.1
MIA 31.1 11 33.1 188 17.1 552 50.2
SEA 27.8 21 33.5 298 14.2 1001 47.7
IND 28.7 11 34.5 96 8.7 475 43.2
SFO 30.5 11 34.6 207 18.8 588 53.5
PHI 30.0 9 35.3 56 6.2 374 41.6
JAX 25.7 5 35.8 65 13.0 244 48.8
CLE 26.8 18 37.9 260 14.4 943 52.4
ARI 26.9 15 38.3 154 10.3 728 48.5
BAL 28.7 10 39.1 91 9.1 482 48.2
DET 29.9 18 39.3 336 18.7 1043 57.9
NOR 30.6 16 39.3 200 12.5 829 51.8
GNB 28.5 15 39.5 228 15.2 820 54.7
CIN 30.3 19 40.4 174 9.2 941 49.5
WAS 25.1 6 40.5 30 5.0 273 45.5
MIN 27.3 11 40.8 90 8.2 539 49.0
BUF 30.2 18 41.2 346 19.2 1088 60.4
TEN 25.8 11 41.7 119 10.8 578 52.5
TAM 26.6 11 41.9 76 6.9 537 48.8
DEN 28.9 16 42.1 173 10.8 846 52.9
HOU 27.7 16 44.0 265 16.6 969 60.6
NYG 28.2 16 45.5 266 16.6 994 62.1
OAK 24.2 9 53.4 76 8.4 557 61.9
LEAGUE 27.9 12.3 36.8 154.9 12.6 607.7 49.5
Note: FP = Field Position. NON-TD INT = the yards produced on all team interceptions that do no result in TDs; this would be the values reported in League statistics minus yardage from pick-sixes.


[1] Pro-Football Reference’ Expected Points model tells us that Amukamara’s INT was worth -3.78 EPA and Harris’ -1.6 EPA but Amukamara’s INT yielded a net EP -3.56 and Harris’, -5.91. Amukamara’s INT is worth a greater EPA value probably due to resultant field position but Harris’ INT has a greater net EPA value because his opponent was near the endzone he was defending.


Friday, December 25, 2015

Approximating the Yardage of an Interception in the Aggregate

So, it is established that an interception is valued at about 60 yards, an increase from the 45 yards it was previously ascribed. The model used to establish that value of 60 yards is one of several based on expected points (EP), this one developed by Brian Burke. EP models provide the average amount of points expected to follow a play on a given down, with a given distance to go, and from a given spot of the ball, based upon the average next-score for all previous plays with a given down, distance, and field position. The next-score may occur on the forthcoming play, the following play, or on a play three possessions later. The next-points could be scored by the offense (TD, FG), the defense (INT or fumble return for TD, safety), or maybe the defense's offense (following TO, turnover on downs, punt or otherwise). Positive EP values indicate offensive success and negative values, failure. 

Estimated points can then be converted to yardage values. For instance, 1st and 10 at the 50-yard line carries +2.0 EP. That indicates that, across many, many 1st and 10 situations at the 50, in many games, and in many seasons, the average next-points equals +2.0 EP. Likewise, 2nd and 8 from the opponent's 48-yard line will carry its own EP.

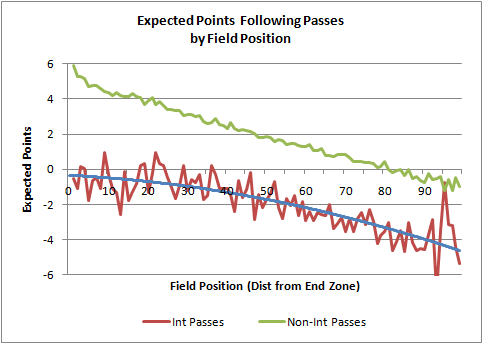
Anyhow, the value of 60 yards is derived from the expected point difference between interception plays and non-interception passing plays, across teams in many seasons. That is, the average EP for all non-interception passing plays from all down, distance, and field position situations compared to that average for all passing plays resulting in an interception. The EP difference between non-interception and interception pass plays is +3.8. For the offense, the EP value of +3.8 is equitable, roughly, to having the ball at the opponents’ 20 yard line. EP for the offense equal zero when the ball is at an offense’s own 20 yard line. The difference of the two field positions is 60 yards, hence the 60-yard valuation of interceptions.

I used Burke’s work to guide my development of team-specific, aggregate yardage values for interceptions. Of course, I sought a yardage value individualized for each team and, accordingly, EP for given down, distance, and field position situations are known to vary by team for teams' offenses and defenses. However
—foreshadowing—computation of within-season team EP values is confounded by a small sample size. Anyways, like EP, an interception yardage value should also vary by team—but how? Well, these were my criteria: INT-yardage should
 

Figure 1.
  • increase for teams with productive offenses (as measured by yards per drive and plays per drive), 
  • increase for teams with efficient scoring offenses (as measured by % of drives end in a score), 
  • decrease for teams that struggle to limit the productivity and scoring efficiency of opposing offenses (as measured by allowed yards per drive and % of drives ending in a score), and
  • decrease for teams turnover prone offenses (as measured by % of a defensive team's offensive drives ending in a turnover).

To start, I sketched a football field and partitioned the field according to defensive drive start and opponents yard per drive. We can sum these two values, which I did for all NFL teams from 2010 through 2014. However, we then subtract that value from 100 ensuring a greater value for defenses that allowed fewer yards. This process, I was certain of and we’ll term it the Defensive Component.

I was less certain of how to include team offensive starting position and offensive yards per drive. Rather surreptitiously, I summed those two values with the Defensive Component above and noticed that the mean across team seasons equaled 100.044. I got excited and termed it the Offensive Component.


I simply subtracted 40 from the sum of the Defense and Offensive components. Voila, the average was 60.044.  Normality for the entire data set appears in Figure 1 with the distribution plotted in orange against a normal curve. In Figure 2 we see that the average of 60 yards is stable across all seasons in the data set, as are the centralities of the standard deviations. 
Figure 2.

The greatest yardage value was 73, for the 2012 Denver Broncos and 2011 New Orleans Saints and the least was 45, for 2014 Oakland Raiders and 2011 Indiana Colts. By several metrics (this one and this one),  Denver ranked among the top offenses and defenses, the New Orleans offense ranked top 1 or 2, Oakland amongst the lowest in offense and toward the bottom in defense, and Indiana relegated itself to the lower bounds offensively and defensively, in their respective seasons. 

Analyzed next were the relationships between interception yardage values and various team-offensive and -defensive attributes bulleted above. As seen in Figure 3 at the bottom of the page, most potent were the rate of offensive scoring drives increasing and rate of scoring drives allowed decreasing with increased yardage values.1 Likewise, the rate of offensive turnovers decreased as interceptions yardage values increased. These associations are ecologically valid because only some interceptions are a pick-six—12.5%—and the defense depends on its offense to capitalize. Absent from Figure 3 is a small r = -.19 (p = .01) for the relationship between Defensive plays per drive and interception yardage.

Also, Pro Football Reference provides EP values for plays so we could use these to compute EP values for, say, the 2012 Denver Broncos.2 Following Burke's methods, we compute the average EP for all non-intercepted, non-4th down passes thrown against the ’12 Broncos defense. Separately, we compute the EP for passes intercepted by the Broncos. Because it is such a small sample size, I also computed League-wide average EP on interceptions for 2012. Non-intercepted, non-4th down passes equaled +2.11 EP and intercepted passes equaled -2.73 and -3.02 EP for league and team averages,  yielding differences of +4.83 and +5.14 EP, respectively.


We could plot non-intercepted pass EP values by field position, as I did initially. Using only the ’12 Broncos’ data, EP is first less than zero at the Opponents’ 35 and EP is first greater than 4.31 at the Broncos’ 29 or so. That would make the INT yardage value 36. Meh....the perils of inadequate power. (For example, see this supplementary figure [green = non-INT] and compare it to Burke's graph in this write-up. The INT EP is League-wide 2012 averages. On my figure, that sharp dip in INT EP around the 95 is the result of insufficient.)

Figure 3.

So, as an alternative approach, I computed the average yard-line field positions for EP ≤0,
≥4.83, and ≥5.13 for non-interception pass plays. For non-interception pass plays against the Broncos D, the average EP ≤0 was about the 23-yard line. Using the difference of the League average INT EP, the average field position was 91-yard line (DEN 9). Using the difference of the Broncos team INT EP average, the average field position was the 94 (DEN 6). That puts the differences at between 69 (league) and 71 (DEN) yards. Recall, the value estimated above for the Broncos was 74; so we're fairly accurate, between +2 to +3 yards using the aggregate method I outlined above. But that's only one team.

It's a fairly simple process—obtaining the PFR EP—but I lack the motivation to check for all teams in seasons 2010-2014. I did check the 2011 Indianapolis Colts. Non-intercepted, non-4th down passes against the Indy' D yielded an average +2.19 EP; League INT, -2.5 EP; and Indy team INT, -2.8 EP. Those EP values equate in field position to ~26 (≤0), 82 (League), and 82 (IND). Thus, the difference equals ~56 yards, or, a difference of about 9 yards from the formula I described above.

Given that disparity, I also checked the 2014 Oakland Raiders. Non-intercepted, non-4th down passes against the Raiders defense yielded an average +2.11 EP; League INT, -2.73 EP; and team INT, -3.03 EP. Those EP values equate in field position to ~28 (≤0), ~78 (League and OAK INT). Those both yield yardage differences of about 50. This is only +5 yards than the 45 I mentioned earlier.

In summation I introduced here a method of computing team-specific yardage values of interceptions. It is well-established that that value is about 60 yards but that value is more so a League average, per se. So, I cross-checked the interceptions yardage values for several teams using estimates based on the EP differences (similar to the method used to obtain the 60 yard value). There were discrepancies between the results of my aggregate method and the EP estimates, two of which were |5| and one was +9. These discrepancies may be due to mathematical failures on my behalf or the crude computation of average field position differences for EP values. It could also be that Burke and PFR obtained EP values with different models. Of course, it could be some other issue that I have overlooked.


Footnotes:

1The decimal values in Figure 3 are Pearson Correlations NOT Linear Regression Coefficients. This is because we are simply interested in relationships between variables (i.e., correlations) not explaining variance of the INT yardage values. However, the fuzzy line for each correlation is based on the linear regression equation. I included the line for convenience in visualizing the relationships.
2Some plays in the PFR lack EP data so those were removed from analysis unless it was a pick-6, in which case I made the EPA -7.